This guide explains how to use uSimmics (formerly QucsStudio) to display a Voltage Standing Wave Ratio (VSWR) graph from antenna S-parameter data. It covers VSWR theory, the relationship between return loss and VSWR, and a complete step-by-step procedure using a real chip antenna example.
What You’ll Learn
- The definition of VSWR and its calculation formula
- The relationship between return loss and VSWR, and when to use each
- How to import an S-parameter file into uSimmics (formerly QucsStudio)
- How to convert a return loss plot to a VSWR plot
- How to interpret VSWR values when evaluating antenna designs
What Is VSWR?
VSWR (Voltage Standing Wave Ratio) measures the ratio of the maximum to minimum amplitude of the standing wave that forms when a portion of a signal traveling along a transmission line reflects back from a mismatched load. The reflected wave interferes with the forward-traveling wave, creating this standing wave pattern.
$$
VSWR = \frac{1 + |\Gamma|}{1 – |\Gamma|}
$$
Here, Γ (gamma) is the reflection coefficient. A smaller magnitude of the reflection coefficient indicates better impedance matching.
| VSWR | Status | Reflected Power |
|---|---|---|
| 1.0 | Perfect match (ideal) | 0% |
| 1.5 | Good — typical antenna design target | ~4% |
| 2.0 | Acceptable lower limit | ~11% |
| 3.0 or higher | Poor matching | ~25% or more |
An ideal VSWR of 1 means perfect impedance matching between the transmission line and the load. For antenna design, VSWR ≤ 1.5 is the common design target.
How VSWR Is Measured
Measuring VSWR requires separating the forward and reflected waves using a directional coupler. In practice, the following instruments are used:
- VSWR meter: A dedicated instrument used in conjunction with a transmitter/receiver
- Vector Network Analyzer (VNA): Measures S-parameters with high accuracy and computes VSWR automatically
Return Loss and VSWR
Return loss is closely related to VSWR. It expresses the fraction of incident power reflected back, in decibels:
$$
\text{Return Loss [dB]} = -20 \log_{10} |\Gamma|
$$
Return loss vs. VSWR correspondence:
| Return Loss | VSWR | Reflected Power |
|---|---|---|
| −20 dB | 1.22 | 1% |
| −14 dB | 1.50 | 4% |
| −10 dB | 1.92 | 10% |
| −6 dB | 3.01 | 25% |
A larger negative return loss value (greater absolute magnitude) indicates less reflection and better matching. uSimmics (formerly QucsStudio) supports both display formats and allows switching between them.
Why VSWR Matters
When VSWR is close to 1 (good matching), nearly all transmit power is delivered to the antenna. As VSWR increases, reflected power grows, causing:
- Reduced power delivery efficiency to the antenna
- Risk of damage to the power amplifier from reflected power (critical in RF systems)
- Degraded receive sensitivity and reduced communication range
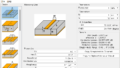
Displaying a VSWR Graph in uSimmics (formerly QucsStudio)
The following steps demonstrate the workflow using S-parameter data for the JOHANSON Technology 2.4 GHz chip antenna 2450AT07A0100001T (available for download from the manufacturer’s website).
Step 1: Launch uSimmics and Create a Project
- Launch uSimmics (formerly QucsStudio).
- Select File → New Project and create a new project.
- Set the project name and save it.
Step 2: Import the S-Parameter File
- In the Project view, navigate to the Components tab.
- From system components, select s-parameter file.
- Place the s-parameter file component on the schematic canvas.
- Double-click the component to open its properties.
- Set Ports to
1(for a 1-port antenna). - Under File, select the downloaded S-parameter file (
.s1p).
Step 3: Run the Simulation
- From the Simulations tab, place an S-Parameter Simulation component on the schematic.
- Set the frequency range (e.g., 1 GHz to 4 GHz).
- Run the simulation.
Step 4: Create the Return Loss Graph
- From the Insert menu, select Diagram → Cartesian Diagram and place it on the canvas.
- Double-click the diagram to open its settings.
- In the Data tab, add
dB(S[1,1])to the graph. - Click OK to display the return loss plot.
In some versions, graphs are created automatically after the simulation runs.
Step 5: Convert to VSWR Display
The return loss graph shows good matching in the 2.4–2.5 GHz band, but the VSWR representation is often more intuitive for antenna evaluation.
- Double-click the graph to open its properties.
- Select the
dB(S[1,1])entry. - Replace the expression with
vswr(S[1,1]). - Click OK.
The graph immediately switches to VSWR. The antenna’s resonant frequency and usable bandwidth are typically easier to identify in the VSWR representation.
Reading the VSWR Graph
In the VSWR graph, the frequency range where the value approaches 1 is the antenna’s resonant band (usable bandwidth). For the 2450AT07A0100001T, VSWR is low (good matching) across the 2.4–2.5 GHz band, confirming suitability for Bluetooth and Wi-Fi at 2.4 GHz.
Summary
This guide covered VSWR fundamentals — definition, calculation formula, and the relationship with return loss — and demonstrated the complete workflow for displaying a VSWR graph from chip antenna S-parameter data in uSimmics (formerly QucsStudio). VSWR is an indispensable metric for evaluating antenna impedance matching and optimizing communication system performance. uSimmics (formerly QucsStudio) makes it straightforward to switch between return loss and VSWR views, enabling rapid evaluation using whichever format is most appropriate.
Related Articles
- LPF Optimization with Real Component S-Parameters in uSimmics (formerly QucsStudio) [2026]
- LPF Design Guide Using uSimmics (formerly QucsStudio) [2026]
- Microstrip Line Characteristic Impedance Calculation in uSimmics (formerly QucsStudio) [2026]
- Monte Carlo Analysis in uSimmics (formerly QucsStudio) [2026]
- Matching Circuit Design Guide

Comment