The Smith Chart is characterized by its beautiful arcs representing the magnitude and phase of the reflection coefficient. By utilizing this chart, it is possible to visually determine the values of circuit elements needed for impedance matching in high-frequency circuit design. Particularly, properly matching impedance between various components such as transmitters and antennas is crucial for minimizing power loss and maximizing signal quality.
1. Fundamentals of the Smith Chart
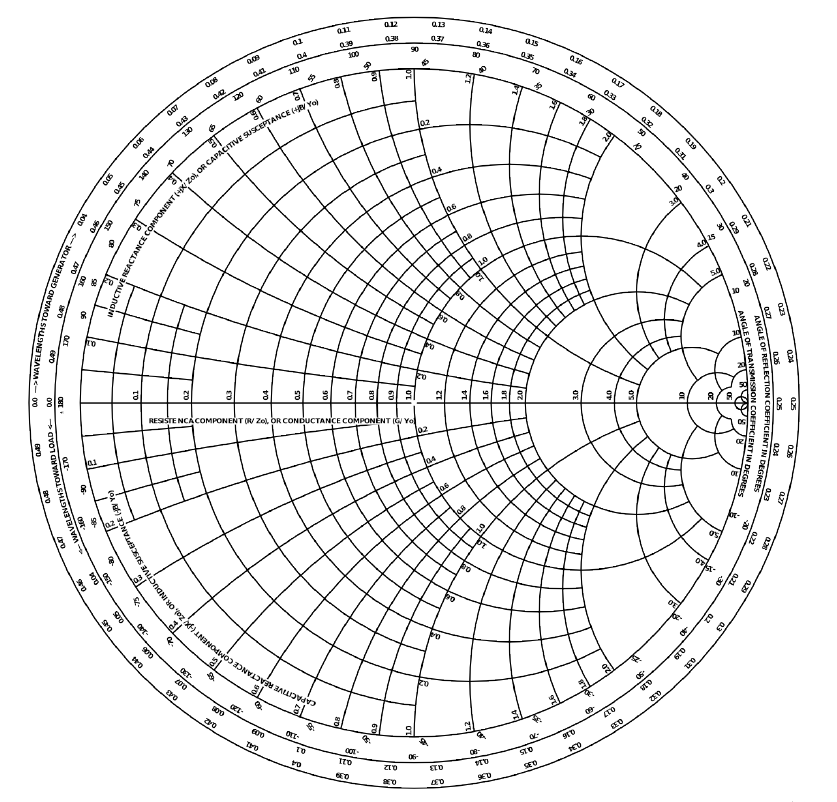
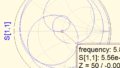
The Smith Chart transforms the graph of the real and imaginary parts of the complex reflection coefficient into a circular form, visually representing the complex impedance plane.
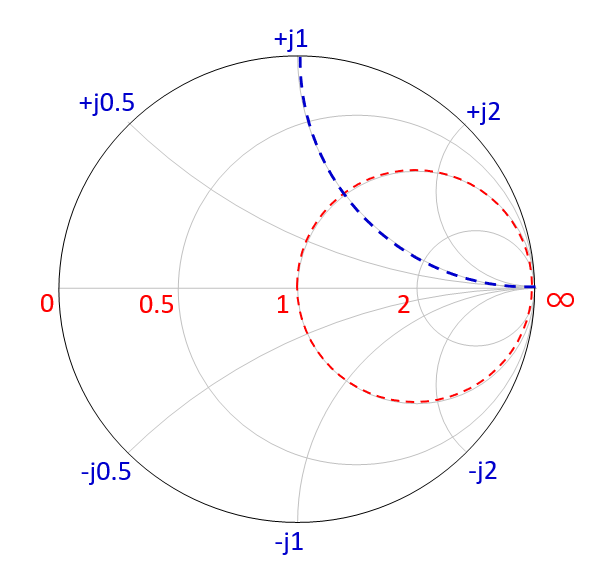
The Smith Chart features constant-resistance circles and constant-reactance circles, where the constant-resistance circles represent the real part (resistance) of the impedance, and the constant-reactance circles represent the imaginary part (reactance).
(The red lines in the figure below represent constant-resistance circles, and the blue lines represent constant-reactance circles.)
This allows for an intuitive understanding of the normalized impedance values.
2. Applications of the Smith Chart
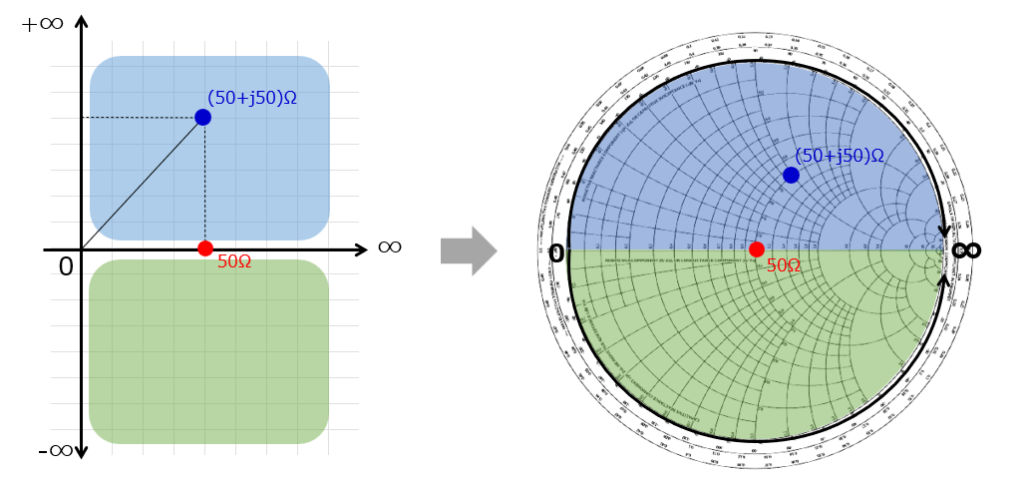
By using the Smith Chart, designers can intuitively think about circuit configurations for impedance matching and guide optimal design. It is possible to represent various impedance states, such as open (infinity), short (0), and equivalent to the characteristic impedance Z0.
In particular, by plotting impedance values normalized to the characteristic impedance Z0 on the Smith Chart, one can visually consider ways to match any impedance value.
4. Smith Chart and QucsStudio
QucsStudio offers many powerful display features, including the Smith Chart, to support the RF design process. By utilizing these display features, it is possible to graphically analyze impedance and reflection coefficients based on high-frequency circuit simulation data, efficiently solving impedance matching issues.
Smith Chart
- Purpose: The Smith Chart is primarily used for analyzing transmission lines and matching networks. It is a tool for intuitively understanding complex numbers such as impedance, admittance, and reflection coefficients.
- How to Use: This chart is used to display normalized impedance or normalized admittance. It is particularly effective for analyzing impedance matching issues in RF (radio frequency) design and designing interfaces between antennas and transmission lines.
Admittance Chart
- Purpose: The Admittance Chart provides a graphical representation of admittance (Y parameters). Like the Smith Chart, it is used for analyzing the behavior of electrical circuits but approaches from the perspective of admittance.
- How to Use: The admittance chart visualizes the admittance characteristics of electrical circuits, particularly useful for analyzing what elements to add or modify to achieve the desired response in filter design or impedance matching problems.
Polar Chart
- Purpose: The Polar Chart is used to represent the relationship between amplitude and phase. This chart is especially effective for displaying frequency responses or phase responses.
- How to Use: By using the polar chart, one can intuitively grasp the response of a circuit or system to frequency (such as gain or phase shift). It is used for analyzing the characteristics of filters, amplifiers, etc.
Smith Polar Combi Chart
- Purpose: The Smith Polar Combi Chart combines the characteristics of both the Smith Chart and the Polar Chart. This allows for the simultaneous analysis of complex impedance or admittance characteristics and the relationship between amplitude and phase.
- How to Use: This chart is particularly useful for designing complex matching networks or understanding the behavior of systems across multiple parameters at once. It visualizes both the impedance matching conditions and the behavior over a specific frequency range simultaneously.
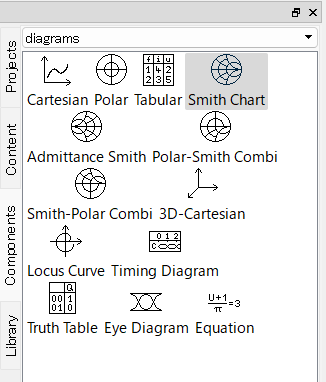
The “components” and “diagrams” sections in QucsStudio contain each of these charts, allowing them to be used as needed.
Conclusion
The Smith Chart is a powerful tool for impedance matching in high-frequency circuit design, enabling intuitive understanding of the magnitude and phase of the reflection coefficient through its circular arcs. Through the constant-resistance and constant-reactance circles, it visually captures the complex impedance plane, allowing designers to derive the optimal circuit configuration for impedance matching. QucsStudio provides a variety of display features, including the Smith Chart, to efficiently support the RF design process. This enables graphical analysis of impedance and reflection coefficients based on high-frequency circuit simulation data, facilitating the resolution of impedance matching issues.
📌 See the recommended reading order (Roadmap)
➡️ Next: VSWR (and return loss) basics
Comment